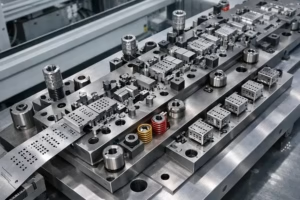







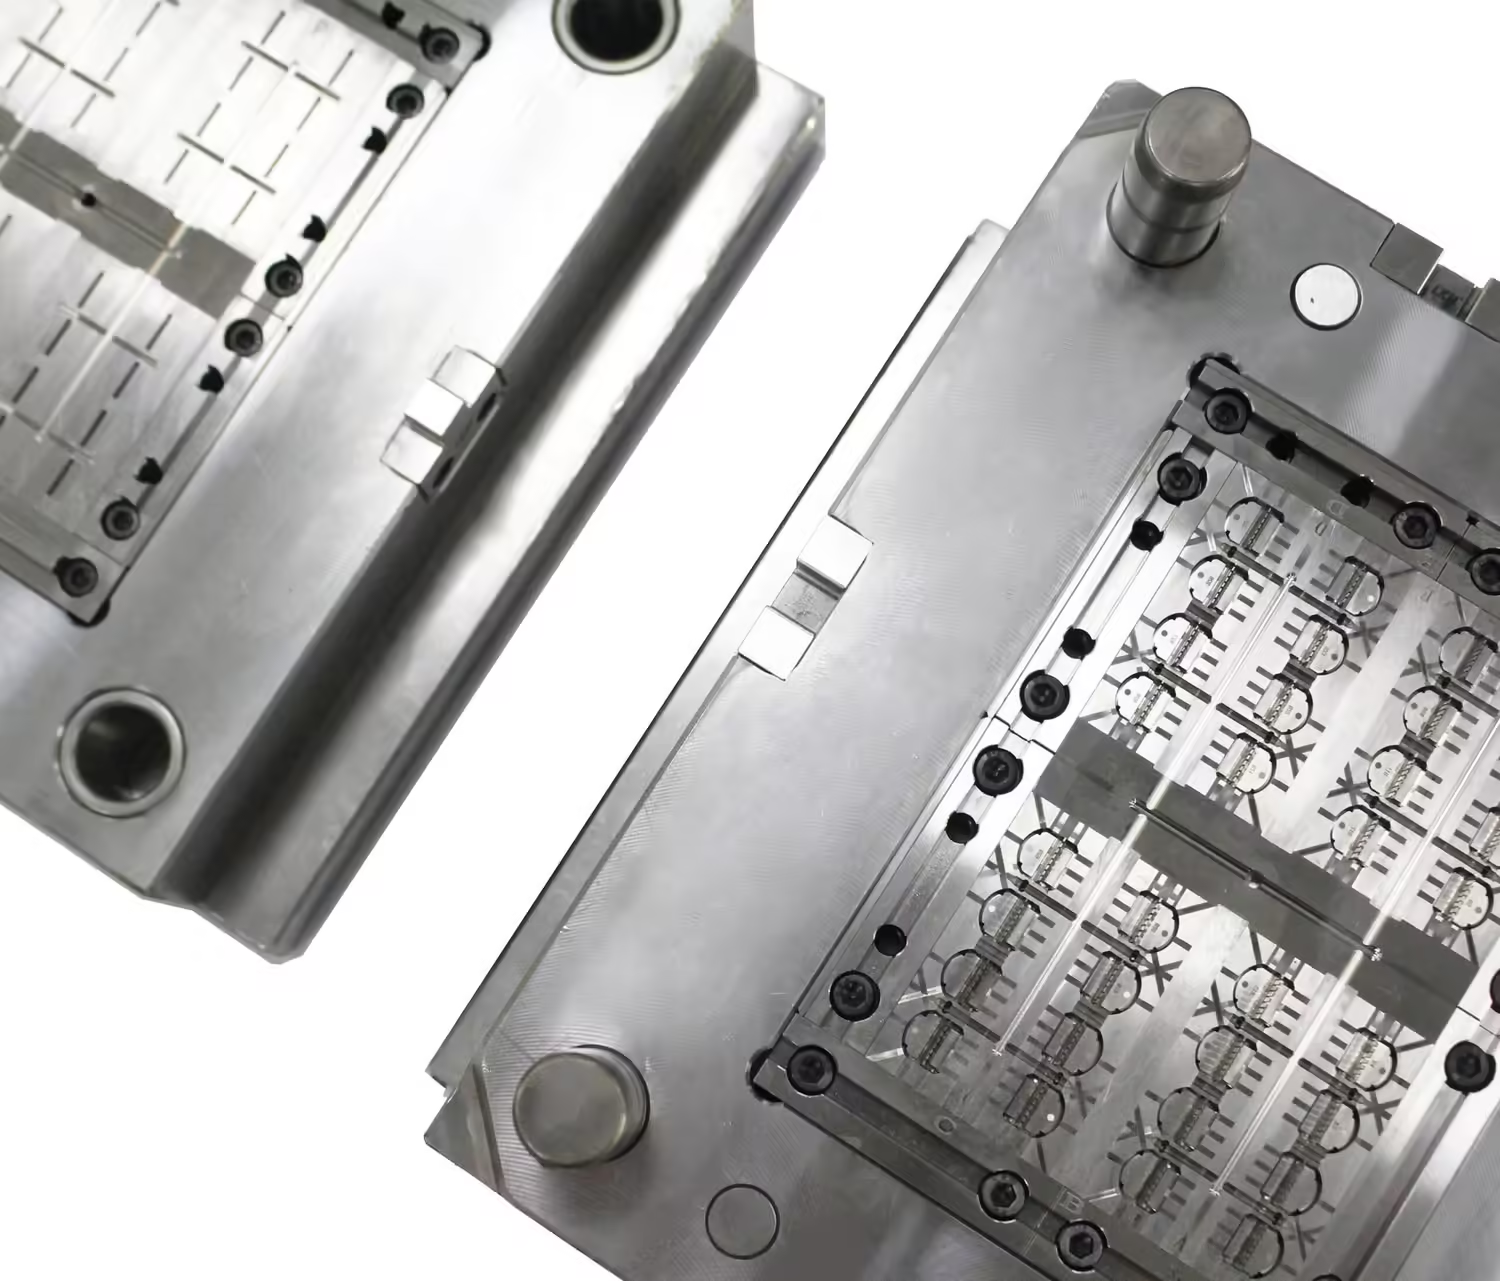
Assess injection mold cavity balance by comparing identified cavities under the same documented filling conditions. Keep sample identity, visible flow extent and mass together, then repeat the comparison before choosing a tooling or process correction. Equal final part weights alone do not establish that the cavities filled together.
Illustrative application study: the four-cavity layout, sampling stages and masses below are hypothetical. No mold was tested and no SSP or customer result is claimed. The worksheets demonstrate a diagnostic review and checked arithmetic, not a qualified machine recipe or universal acceptance limit.
This guide explains how to check cavity filling balance without turning a total-shot average into a cavity-level conclusion. The intended reader is an OEM molding or tooling engineer deciding what to investigate, which evidence supports a proposed change and what remains to be validated.
Injection mold cavity balance starts with a defined question
First, state whether the concern is unequal filling, a cavity-specific incomplete feature or variation in a finished component. Define the response that matters to the product. A dimensional discrepancy or cosmetic difference should not automatically be relabeled as a runner-balance problem.
Next, record whether the tool produces identical parts or a family of different components. This injection mold cavity balance example assumes four identical nominal cavity geometries. Equal mass is not a suitable comparison target for different parts unless a separate normalization and its physical meaning have been agreed.
Then establish stable cavity identifiers and a map of the actual tool. Beaumont’s cavity-ID guidance explains why identification supports short-shot analysis and how the numbering can retain useful relationships to the feed system. Its specific flow-group approach requires the actual runner layout.
For injection mold cavity balance, associate each sample with its cavity, shot and sampling condition. Keep tool orientation and feed-path labels visible. If a partial part does not retain its molded identification, agree a collection and labeling method that preserves that association before weighing or photographing it.
Before collecting injection mold cavity balance evidence, identify what a successful review will decide. For example, the team may need to determine whether one cavity consistently leads under a controlled condition. That question requires cavity-level observations; it cannot be closed by a total shot mass alone.
Additionally, retain the drawing revision, resin grade and lot, material preparation record, tool configuration and machine identity. In injection mold cavity balance, these entries define the scope of the evidence. They should remain attached to the study even when the immediate comparison is a simple table.
Collect short shots under a controlled study plan
First, distinguish the filling observation from the later packing response. RJG’s fill-only discussion explains why a weight comparison against a finished part can be misleading, including effects associated with compressibility and gate seal. It also describes geometry-dependent exceptions to simple visual or weight-based targets.
Next, have the responsible process engineer document how the selected short shots will be produced on the actual mold and machine. Record the filling and transfer conditions, how packing is excluded from the intended observation and what remains unchanged. This guide does not prescribe a universal transfer position or percentage-full recipe.
For injection mold cavity balance, choose observations that answer the stated question rather than collecting only the easiest sample. Retain the visible extent of the partial part and any relevant machine traces. State whether a sample is a fill-only observation or a complete part produced with subsequent packing.
Then record the complete sample set for injection mold cavity balance from the same shot. Keep each cavity’s specimen separate and define how attached feed material is excluded or handled in the mass record. Use a consistent collection and weighing condition, including any agreed specimen preparation, for the comparison.
If short shots are compared across stages, keep the injection mold cavity balance record explicit about what distinguishes them. Do not silently change material, temperature, speed or tooling at the same time and then attribute the observed difference to one factor. Mark missing cavities, incomplete records and invalid collection events instead of substituting an assumed value.
Before interpreting injection mold cavity balance, repeat the relevant observation under the defined baseline and retain the shot-to-shot spread. Decide the repetition plan with the responsible engineer. One sample from each cavity cannot demonstrate repeatability, even when the cavity ranking looks clear.
Additionally, specify the mass measurement method and its resolution and uncertainty where available. If a proposed difference is too small for the measurement evidence to distinguish, report that limitation. Do not convert a displayed decimal place into a verified measurement capability.
Use a cavity-by-cavity comparison with explicit limits
For the hypothetical injection mold cavity balance example, assume stages L and H represent an earlier and a later fill-only sampling condition. Each stage contains one invented observation for each cavity. Neither stage is a before/after improvement, and neither establishes a percentage of cavity volume filled.
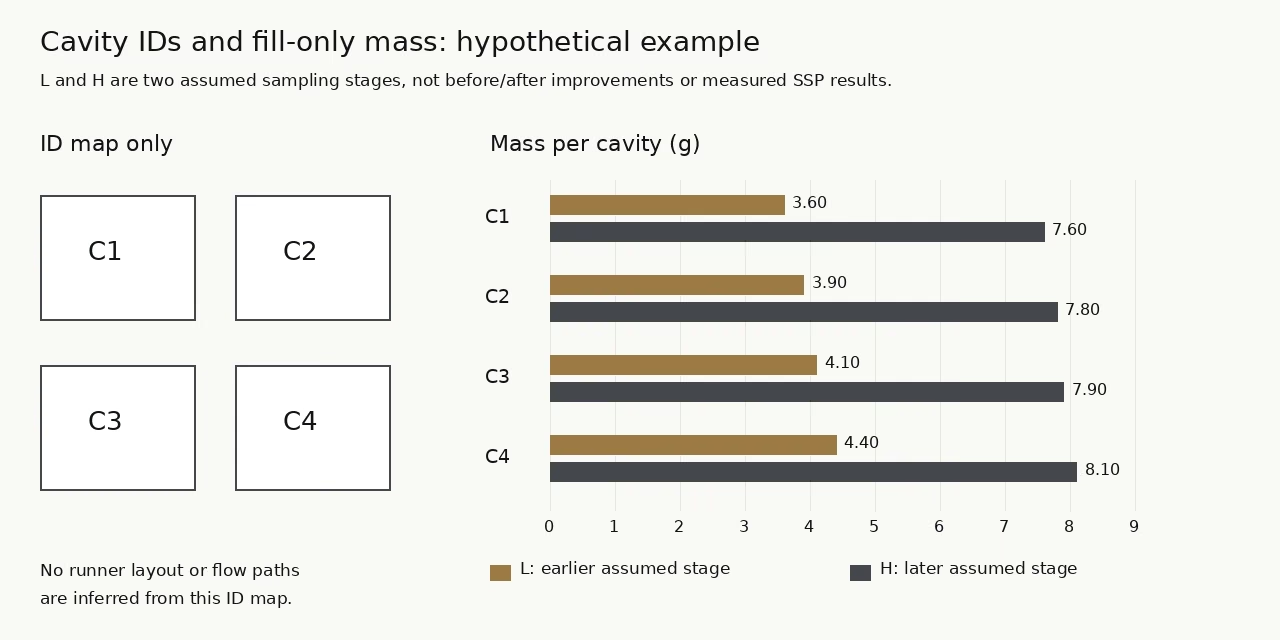
First, preserve the absolute masses in grams in the injection mold cavity balance worksheet. The table also expresses each cavity’s departure from its stage mean. This separates the amount of material in the assumed sample from its position within that particular comparison.
| Cavity | Stage L mass, g | L departure, % | Stage H mass, g | H departure, % |
|---|---|---|---|---|
| C1 | 3.60 | −10.00 | 7.60 | −3.18 |
| C2 | 3.90 | −2.50 | 7.80 | −0.64 |
| C3 | 4.10 | +2.50 | 7.90 | +0.64 |
| C4 | 4.40 | +10.00 | 8.10 | +3.18 |
Calculate the cavity filling comparison consistently
For this injection mold cavity balance worksheet, define the stage mean as m̄ = Σmᵢ/n, where n is the number of included cavities. Define relative departure as dᵢ = 100(mᵢ − m̄)/m̄. These are descriptive arithmetic definitions for this example, not an industry acceptance standard.
Then calculate L: the assumed total is 3.60 + 3.90 + 4.10 + 4.40 = 16.00 g, so the mean is 16.00/4 = 4.00 g. C1’s departure is 100(3.60 − 4.00)/4.00 = −10.00%. C4 is +10.00% on the same basis.
Next, calculate H: the assumed total is 7.60 + 7.80 + 7.90 + 8.10 = 31.40 g, giving a mean of 7.85 g. For C1, 100(7.60 − 7.85)/7.85 = −3.1847%, rounded to −3.18%. C4 is +3.18%, rounded.
For an injection mold cavity balance range indicator, define S = 100(mmax − mmin)/m̄. The hypothetical L value is 100(4.40 − 3.60)/4.00 = 20.00%. The hypothetical H value is 100(8.10 − 7.60)/7.85 = 6.3694%, rounded to 6.37%. Always state this denominator when sharing the result.
Consequently, this cavity filling comparison shows a smaller relative mass range at H than at L. It does not show that a correction improved the mold: the sampling stage changed. There are no repeated observations, flow-front photographs or pressure records in the invented dataset to establish a cause.
For injection mold cavity balance, retain the individual readings as well as the summary. Here C1 remains the lightest and C4 the heaviest in both assumed stages. That is a useful question for a repeat study, not proof that a specific gate, runner or thermal condition is responsible.
If one cavity reading changes by an assumed 0.10 g, both the stage total and the mean change. Recalculate the departures and range indicator from the revised data. Do not retain an old denominator or compare percentages computed by different definitions.
Separate simulation predictions from diagnostic hypotheses
First, label each record by how it was obtained: a simulation prediction, a physical observation or an engineering hypothesis. For injection mold cavity balance, use a common cavity map to connect those records while keeping their evidential roles separate.
As simulation context, Autodesk describes Runner Balance analysis as changing runner dimensions toward simultaneous filling with controlled flow-path pressure behavior. It calls for checking molding conditions, gate locations and cavity balance before that analysis. A calculated proposal is not a physical validation result.
Next, compare injection mold cavity balance predictions and samples at a declared reference condition. Keep the cavity filling comparison tied to that condition. Record the model revision, material data, boundary conditions and result being examined. If the sample and prediction represent different conditions, state the mismatch before interpreting their apparent agreement or disagreement.
For multi-cavity mold balance, use the worksheet below to identify evidence that would distinguish competing explanations. Its rows are proposed investigation questions, not diagnoses derived from the hypothetical masses. A consistent cavity ranking alone does not select one row.
| Hypothesis to examine | Evidence to collect | Controlled comparison | Limit of the conclusion |
|---|---|---|---|
| Local feed or cavity geometry differs | Relevant insert, gate, runner and cavity inspection records | Same identified cavities under the documented baseline | Mass ranking does not itself measure the geometry |
| Flow-path history contributes to a pattern | Actual runner map, flow-group review and relevant simulation | Group observations by their verified feed-path relationship | ID-map proximity alone does not establish shared flow history |
| Thermal or process condition differs | Relevant measured conditions and synchronized process records | Agreed test varying the named factor while documenting other conditions | Controller setpoint or one changed shot is insufficient by itself |
| Collection or measurement changes the apparent result | Specimen identity, feed-material handling and mass-method records | Repeat collection and measurement under the defined method | A valid mass comparison still does not establish every part-quality requirement |
Then select the next test that addresses the strongest unresolved question. In injection mold cavity balance, document what result would support the hypothesis, what would weaken it and what would remain unknown. Avoid making a tooling change merely because one percentage appears large.
Before a proposed geometry correction for injection mold cavity balance, preserve the original drawing and inspection evidence. If the team changes a runner, gate or insert, identify the revision and expected effect before retesting. Keep process and tooling changes traceable so their contributions can be assessed.
Retest the finding and close the release decision
First, repeat the relevant injection mold cavity balance comparison using the same cavity identities, collection method and declared conditions. Record any deliberate difference. Compare the physical evidence against the pre-agreed study question instead of choosing a new success criterion after seeing the data.
When documenting how to check cavity filling balance, retain a worksheet containing shot identity, cavity identity, sampling stage, mass, visible extent and relevant process evidence. Add the calculation definition and the acceptance owner. Mark assumptions and missing measurements where they occur.
Then evaluate complete parts against their drawing and functional requirements using the authorized production condition. A fill-only diagnostic study answers a different question from the final component release. Equal final weights do not independently prove simultaneous filling, dimensional conformity or acceptable assembly function.
For injection mold cavity balance, agree any acceptance criterion with the responsible quality and tooling engineers. Define which cavities, material conditions and operating scope it covers. This guide proposes no universal percentage limit and makes no production-capability claim from its single-observation example.
Next, keep broader process qualification with the process-window validation guide. The present study isolates a cavity-comparison question; it does not recreate the full operating-window exercise or approve every downstream part response.
Finally, discuss the physical tool arrangement using SSP’s injection mold product information and the trial requirements through its injection molding service. For a review with SSP Precision, provide the cavity map, material record and traceable evidence.
Key takeaways
- Link injection mold cavity balance observations to the actual cavity and shot.
- Keep absolute masses, visible fill evidence and explicitly defined comparison metrics together.
- Separate sampling-stage differences from demonstrated improvements after a correction.
- Release the part through its own dimensional and functional evidence as well as the diagnostic review.
Frequently asked questions
Can a total shot weight establish multi-cavity mold balance?
A total combines the cavities and can conceal their individual differences. Retain identified cavity observations under a defined sampling condition, then evaluate the evidence and its limitations before making a balance decision.
Does the example’s range percentage define a pass limit?
No. The percentage is a descriptive calculation with an explicitly stated denominator. An acceptance criterion needs an approved scope and supporting engineering evidence; it is not supplied by the invented masses.
Are simulated runner-balance results equivalent to a mold trial?
Keep the prediction and physical evidence separately labeled. Compare them under documented conditions, investigate differences and retain the required part-quality checks before release.