







Validate weld line strength against the load case of the molded housing, using production-representative parts and a defined acceptance plan. Use flow analysis to identify the junction to investigate. Then measure the component response and record where damage starts.
For an OEM reliability review, the decision is whether the housing meets its requirement when a flow-front junction crosses a loaded region. This guide shows how to validate weld line strength by linking a predicted location, controlled samples and an observed component result.
Define weld line strength for the housing load case
First, identify the applied load, its direction and the surfaces that react it. The illustrative housing has a rectangular opening and four mounting points. A component load acts in the plane of the wall. The review asks whether damage starts in the ligament above the opening where simulation predicts a junction.
A weld line forms when separated melt fronts meet during filling. Autodesk describes possible locations around holes, inserts and multiple gates, and explains that the condition of the meeting fronts affects their joining. Its Moldflow guidance on weld and meld lines also notes that a coarse mesh may omit a line from the displayed result.
Next, define what weld line strength means in this qualification record. For the housing, record the load at first observed damage, the damage location and the required proof response. For a tensile specimen, record the stress and test conditions. Keep those quantities identified in the report because they have different units and geometries.
In this example, the design team sets a minimum proof load of 250 N, a maximum displacement of 1.20 mm at that load, and no visible crack under the agreed observation method. These assumed criteria apply to one fixture and loading direction. The actual product team must set its own limits, duration and observation method.
Before ordering trials for weld line strength, document whether the service requirement includes sustained load, cycling, impact or environmental exposure. A brief load application answers the brief proof question. Add the relevant time or environmental conditions to the qualification plan when those conditions form part of the product requirement.
For weld line strength at a mounting feature, specify the mating hardware and assembly state. In the study, the housing is mounted at the four identified holes with a controlled seating procedure. Record the fixture, fasteners and assembly procedure so another laboratory can reproduce the restraint.
Locate the junction in the actual molded part
Map the knit line before selecting samples
First, save the simulation model revision, resin data, mesh and process assumptions. Mark the predicted junction on a common part view. Use a knit line location map to identify the region for inspection before the load test, including which side of the opening to observe.
Then compare prediction with the molded sample at a defined condition and magnification as part of the weld line strength review. If the surface trace is visible, record the knit line location with the sample ID and cavity. If the junction cannot be located from the available inspection, retain that uncertainty in the record and agree on further examination with the responsible materials team.
For weld line strength, a model image gives a location hypothesis. The qualification still needs a measured component response. Where a simulation includes a mechanical-strength model, retain its material calibration and assumptions and document how the validation test challenges them.
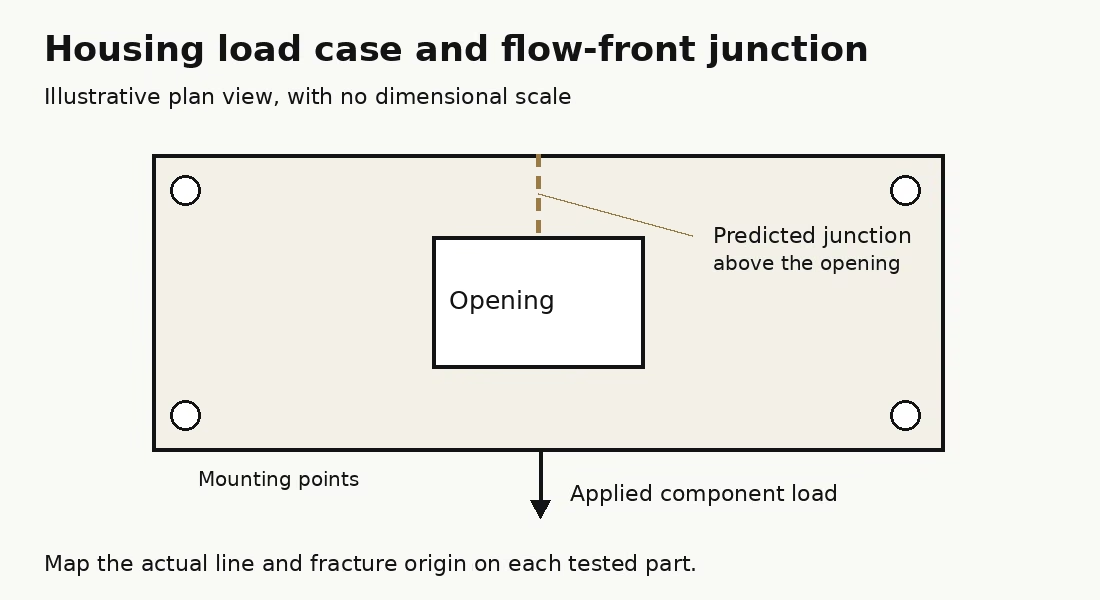
If a trial moves the gate, annotate the new junction on the same view. Check whether the critical ligament, local wall thickness or flow history has changed at the same time. Record these changes before comparing the two components for weld line strength.
Likewise, if the same geometry is molded at two process conditions, preserve the observed filling and sample records for each. Use the process-window guide for the broader trial boundary review. Here the intended output is a traceable relationship between the selected condition, junction and load result.
Plan weld line testing at specimen and component levels
For a material comparison, define specimen geometry, resin grade, filler content, conditioning, test rate and the location of the junction relative to the load. ISO 527-1:2019 sets general principles for determining plastics tensile properties under defined conditions. The detailed specimen and method must match the applicable part of the series and the agreed test plan.
Additionally, a resin supplier’s example shows why material identity matters. The Celanese Vectra LCP design guide discusses orientation and different weld-line configurations for its materials. Use the supplier’s data only within its stated material and specimen conditions. Obtain grade-specific evidence for the resin actually proposed for the housing.
Then set up weld line testing with a specimen comparison that answers a defined question. If a reference specimen has a different junction arrangement, identify it in the data. Retain the measured dimensions and failure location for each specimen so the team can interpret the results with the molding history.
For the component, run the molded housing load test with the actual restraint and required load path. Preserve the as-molded condition unless a specified finishing or conditioning step is part of the approved process. Attach the incoming sample check and any pre-existing damage observations.
| Group | Controlled input | Allocation | Evidence retained |
|---|---|---|---|
| A, baseline condition | One resin grade and lot, one cavity, baseline process | 5 housings | Junction location, proof response, damage location and full trace |
| B, controlled process change | Same material, cavity, fixture and part revision; one agreed process change | 5 housings | Actual condition record and the same component observations |
| C, candidate tooling change | Same nominal part geometry; documented revised gate arrangement | 5 housings | Updated filling prediction, actual junction map and component observations |
In this example, 5 + 5 + 5 = 15 housings are allocated to an exploratory screen. That allocation is a hypothetical planning choice. The required sample count and lot coverage for a production approval must come from the product’s reliability and quality plan.
Before changing the physical tool, review the candidate arrangement against the injection mold configuration. For weld line strength, record which flow or geometry input changed and which remained fixed. A changed gate arrangement may require fresh examination of the assembly dimensions as well as the junction.
During each run of weld line testing, capture the load and displacement trace, observation method, damage onset and final condition. If the fixture slips or a fastener loosens, retain the event and classify the run according to the approved test plan. Preserve the original data when a replacement test is needed.
Use the result and failure location for release
To document how to validate weld line strength, use a result sheet with one row per housing. Identify the group, cavity, stock and resin trace, conditioning and fixture. State the criterion before entering the measured outcome so the acceptance decision is reviewable.
| Sample | Observed event | Displacement at 250 N | Decision for this run |
|---|---|---|---|
| A1 | Crack starts at the mapped junction at 230 N | Proof point not reached intact | Fails the no-crack proof requirement |
| B1 | No visible crack through the prescribed proof step | 0.95 mm | Meets these example individual criteria |
| C1 | Crack starts at a mounting feature at 240 N | Proof point not reached intact | Fails the component proof requirement; investigate that feature |
For sample A1, the damage load is 250 − 230 = 20 N below the required proof point. For B1, the observed proof displacement is 1.20 − 0.95 = 0.25 mm below its assumed limit. For C1, the component cracks 250 − 240 = 10 N before the proof point.
Consequently, B1 meets the stated individual criteria, while its group still needs review against the approved qualification plan. The table contains selected illustrative outcomes. It cannot establish group yield, production capability or a characteristic weld line strength value.
If damage starts at a mounting feature, record that origin and the component failure. A fracture away from the mapped junction leaves the junction’s ultimate capacity undetermined in this setup. Review the housing load path before deciding what further test could isolate the concern.
Likewise, if a sample reaches the proof point intact, retain exactly that conclusion with the inspection method and load history. To determine ultimate weld line strength, a separate agreed test would need to continue to the relevant endpoint while controlling the other possible failure modes.
For a weld line strength change review, compare each sample’s response with its junction location and molding record. If the failure mechanism changes, describe the change directly. Then use the weld line strength record to decide whether a tooling change, process study or component redesign is the next controlled step.
Before production release, attach the weld line strength validation requirement and unresolved observations to the plastic molding production review. For a discussion with SSP Precision, supply the CAD model, resin grade, assembly load and intended validation criteria.
Key takeaways
- Define weld line strength in terms of the tested geometry, units, conditioning and load case.
- Use a junction map, specimen evidence and the mounted component record to evaluate the proposed change.
- Release against the product’s complete criteria and retain the fracture origin with each run.
Frequently asked questions
Can a molded housing load test replace a resin tensile specimen?
The housing test evaluates the component in its defined fixture. A tensile specimen characterizes the specified specimen and material conditions. Use each result for the question it was designed to answer in the validation plan.
Does a visible knit line give a strength value?
Its appearance helps locate a region to examine. To report weld line strength, obtain a measured result under defined conditions and retain the relevant damage location and loading record.
Can a proof pass establish the ultimate failure load?
A proof pass establishes that the specimen met the stated criteria through the prescribed proof step. The ultimate failure load remains to be measured if the qualification requires it.